
Smash, Count, Repeat — How a Physics Puzzle Ships 3,407 Creatives in a Single Month
A slingshot physics puzzle shipped 3,407 creatives and 4,791 ad plans in October, two-thirds of it on AppLovin and AdMob. The channels and creatives inside.
Daniel Brooks
Creative Strategy Analyst
Published
Updated
Smash, Count, Repeat — How a Physics Puzzle Ships 3,407 Creatives in a Single Month
Royal Smash!, a slingshot physics puzzle from Cypher Games, spent October running one of the largest single-title creative operations we have measured: 4,791 ad plans and 3,407 distinct creatives active inside the month — roughly double its September account — with two-thirds of plan coverage on AppLovin and AdMob. Inside the same month, the active account was throttled back 40%, from 1,867 creatives on October 10 to 1,119 by October 31, while production never stopped. This is not a launch story; it is what always-on buying looks like at factory scale.
What this breakdown covers
- A near-doubling, then a throttle. Against September, October ran 90% more plans (2,520 → 4,791) and 86% more creatives (1,829 → 3,407) — then cut the active account 40% inside the month, from 1,867 creatives on October 10 to 1,119 by October 31, and on down to 712 by November 9.
- Factory volume, replace-not-reuse. Only 139 of the 3,407 October creatives carry a reinvestment flag (4.1%). The account's seven biggest production days shipped 1,044 new creatives between them — 459 on October 17 alone, alongside 520 new plans in the same twenty-four hours.
- Networks produce, Meta duplicates. AppLovin carried 2,108 creatives on 2,213 plans — about one plan per creative — and took 1,063 of the month's new builds. Each Meta surface ran roughly 155 creatives under 503–520 plans, about 3.3 plans per creative: the bulk-duplication signature, plus 428 plans on WhatsApp.
- Global breadth, no single-market bets. 215 country codes appear in targeting. The US leads at 53.0% of plans but keeps only 215 of its 2,539 plans exclusive; Japan follows at 44.7% with 89. As the account widened, per-market coverage diluted — the US share fell from 62.3% in September to 53.0% in October while its coverage count grew from 1,571 to 2,539.
The scale: October nearly doubled the account
Royal Smash! is a cannon-and-collapse puzzle: a first-person cannon at the bottom of the screen, a tower of gift boxes and candy tubes on a turntable, and a Moves counter that rewards knocking the right blocks off in the right order. Cypher Games has been scaling it for most of 2026 — Google Play's public label reads 10,000,000+ with an internal cumulative snapshot of 14,855,218 — and we covered its July climb to the top of the US casual chart in August. October is a different story from that climb. But it is not a plateau either: measured against September, October was a step-change.
September's account was already substantial — 2,520 plans and 1,829 creatives. October ran 4,791 plans and 3,407 distinct creatives, with a lifecycle exposure estimate of 976.0M for the October cohort. The near-doubling was broad-based, not a one-channel spike: AdMob's plan count more than doubled (475 → 1,025), AppLovin's rose 85% (1,196 → 2,213), each Meta surface nearly tripled (190 → 503–520 plans), and WhatsApp went from 137 to 428 plans. Reuse stayed near the floor in both months — 4.8% of September creatives carried a reinvestment flag, 4.1% in October — which tells you the growth came from new production, not from re-running winners.
The rhythm: a managed wind-down
The month's own shape matters as much as its totals. The active account peaked at 1,867 creatives and 2,161 plans on October 10, stepped down after the peak, re-spiked to 1,792 on October 17 — the month's biggest production day, with 459 new creatives and 520 new plans shipped in twenty-four hours — and then declined steadily to 1,119 creatives and 1,434 plans by October 31. That is a 40% cut in the active set inside the month. Production never stopped while it happened: the biggest production days of the month are October 17 (459 new), October 10 (182), October 7 (109), October 25 (85), October 5 (72), October 30 (73) and October 6 (64) — 1,044 new creatives across those seven days alone.
The channel map: networks produce, Meta duplicates
The plan-coverage ranking is one thing; how much creative each channel actually consumes is another, and the two tell opposite stories. On the network side, AppLovin ran 2,108 distinct creatives against 2,213 plans — about 1.05 plans per creative — and 1,063 of those creatives were first seen in October alone. AdMob ran 774 creatives against 1,025 plans, with 608 new. Unity (244 creatives, 123 new), Mintegral (240, 119 new) and ironSource (173, 102 new) follow the same pattern: many assets, few plans each, constant replacement.
The Meta side inverts the ratio. Each of the four surfaces — Facebook and Audience Network at 520 plans, Instagram at 517, Threads at 503 — ran roughly 155 creatives, about 3.3 plans per creative, with 148 of those creatives new in October. That is a template operation: one long gameplay edit duplicated across plans and placements, every placement enabled, WhatsApp adding 428 more plans on the same inventory. And one channel stands out in the other direction: YouTube carried 76 October plans on 52 creatives with zero new builds in the month. The channel that carried the July chart run has become a legacy shelf — still live, no longer fed.
Global breadth, no single-market bets
The market map matches the channel map: breadth over depth. 215 country codes appear in the targeting data. The US covers 2,539 plans (53.0%) but keeps only 215 to itself; Japan covers 2,143 (44.7%) with 89 exclusive; Canada (2,067, 43.1%), Singapore (1,788, 37.3%), Germany (1,770, 36.9%), the UK (1,753, 36.6%), Switzerland, Australia, France and Spain fill the 32–36% band, none with more than 89 exclusives. Below the top tier, roughly 150 country codes sit at 14–31 plans each — the residue of worldwide targeting toggles rather than deliberate local buys. And as the account doubled, coverage per market diluted: the US share fell from 62.3% in September to 53.0% in October, and Japan's from 57.7% to 44.7%, even as both markets' absolute plan counts grew by 60%+. No market gets a locally built account — one global creative engine feeds every surface at once, and the market list just gets longer.
Inside the creatives: real gameplay, real physics, no fail-bait
The format discipline is striking for an account shipping at this volume. The heaviest October units are unbroken real-gameplay clears: a cannon shot, a tower collapse, a Moves counter ticking down, a level number advancing. We found no fake-fail frames in the top group. The Google-side units share one caption — the store listing's own copy, “It takes seconds to learn, but mastering every royal level requires true precision and perfect timing” — while the Meta units carry short benefit lines and clone in families.
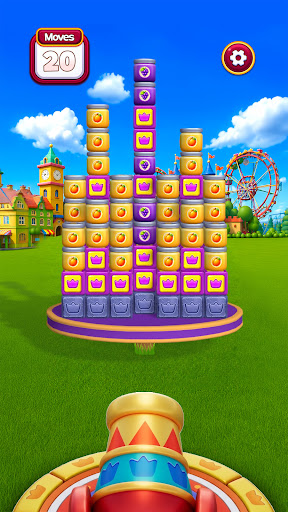
The playable bench, and the localized middle
The playable above is not alone. The monitored set holds more than forty distinct interactive builds for this title, most of them on AppLovin with a parallel line on Mintegral and Vungle — the second-heaviest has run since July 6 with 3.12M estimated exposure, and several more sit in the 1.3–2.6M band. The Mintegral and Vungle builds are where localization actually happens: captioned variants in French, Italian, German and Swedish, against English-only on AppLovin. The same pattern repeats in video and static — the heaviest English units dominate globally, while the middle of the account carries localized caption clones (German, Japanese, Spanish, French, Italian) and statics in Ukrainian, Swedish and Portuguese on Mintegral. Localization is a Mintegral play here, not a market-by-market strategy.
One more thing the long tail shows: scale buys junk tolerance. A cluster of early-October Meta statics — a few dozen units, exposure in the tens of thousands, mostly live for two or three days — carries generic star-rating cards (“★★★★★ 4.8/5.0”), and at least two units whose long Italian body text is a first-person slots-app narrative with no connection to this game at all. That reads as template or mis-paired delivery slipping into a bulk-duplicated account, and it is exactly where junk hides when you ship 3,400 units a month. It does not dent the headline numbers; it does tell you to read volume as a scale signal, not a quality signal.
What a month like this says
Three takeaways. First, creative volume is the budget. A 3,407-creative month with 4.1% reuse means production, not media optimisation, is the scaling constraint — the account's answer to fatigue is to ship 459 new units on a Thursday, not to re-run last month's winner. For anyone benchmarking casual UA at scale, that is the number to beat.
Second, the networks-first map holds at every size we have measured this month, and October sharpened it. BirdFly skipped Meta entirely on a modest account; Royal Smash nearly doubled its Meta plan counts month-over-month (190 → ~515 per surface) and Meta still only templates — AppLovin and AdMob carry two-thirds of the coverage and, critically, almost all of the production: 1,671 of the month's new builds landed on those two channels alone. The playable that has lived on AppLovin since July — one build, four months, 3.38M exposure — shows why: interactive units at this scale are a network-native format.
Third, the wind-down is a signal, not an accident. A 40% decline in active creatives across October, continuing to 712 by November 9, with production still running, points to a deliberate scale-down after a chart cycle rather than budget exhaustion — the account is trimming its tail, not its head. Whether the floor settles around the November level or the machine spins back up for the next push is the question the next window answers.
Track creative velocity — new units per day, reuse rate, playable share — across the monitored set before you commit next quarter's budget.
See what CreativeScope coversQuestions we get about this one
- How big is Royal Smash!?
- Google Play's public label reads 10,000,000+ with an internal cumulative snapshot of 14,855,218. Its October account — 4,791 plans and 3,407 creatives with a lifecycle exposure estimate of 976.0M — is among the largest single-title operations we have measured.
- How does October compare with September?
- October nearly doubled the account: 2,520 → 4,791 plans (+90%) and 1,829 → 3,407 creatives (+86%). AdMob's plan count more than doubled, each Meta surface nearly tripled, and WhatsApp grew from 137 to 428 plans. Reinvestment stayed near the floor in both months (4.8% → 4.1%), so the growth came from new production.
- Did the buying stop after October?
- No. The decline continued — 712 active creatives and 897 plans by November 9 — but the account was still live and still shipping new units at the edge of our data. October is best read as a managed wind-down inside a scale-up month, not a shutdown.
- Is Royal Smash on Meta?
- Yes, as a template. Facebook and Audience Network each cover 520 October plans, Instagram 517 and Threads 503 (10.5–10.9%), near-identical counts consistent with bulk-duplicated plans and every placement enabled. WhatsApp adds 428 plans. But each surface runs only about 155 creatives — roughly 3.3 plans per creative — against AppLovin's 2,108 creatives on 2,213 plans.
- Is the creative localized?
- The heaviest units are not: they share one English caption lifted from the store listing. Localization lives in the middle of the account and on specific networks — playable builds captioned in French, Italian, German and Swedish on Mintegral and Vungle, video caption clones in German, Japanese, Spanish, French and Italian, and statics in Ukrainian, Swedish and Portuguese. Localization depth beyond the monitored set is not measurable here.
- Why do the biggest exposure figures sit outside October?
- Because they are lifecycle estimates. The account's heaviest current units — 12.3M, 11.4M and 8.8M estimated exposure — only began delivering on November 7–9, inside the latest snapshot. The October figures here cover creatives whose delivery overlapped the month.
Method. Figures come from CreativeScope's delivery data for Royal Smash! - Physics Puzzle (developer listed as Cypher Games) over October 1 – October 31, 2026, with the latest material snapshot dated November 9 and the latest ad-plan snapshot covering October; September comparisons use the September 1 – 30 window on the same account. The monitored set is periodically recalibrated, so counts can shift a few units between snapshots. The publisher also runs a second monitored account for the same title (the iOS package), which carried roughly 1,100 active plans in the same period; its figures are excluded here to avoid double counting. Trend readings after October 31 are shown for context only. Estimated exposure is a global lifecycle estimate per creative, not a date-range increment, and does not measure conversion, retention or return.
Scope limits. Channel and market shares are computed on plan coverage with multi-attribution, so they overlap and do not sum to 100%. An identical share across several surfaces reflects one plan targeting several placements, not separate buys. Plans-per-creative ratios divide each channel's plan-coverage count by its distinct-creative count; because both are multi-attribution, the ratios are directional, not exact. Download figures combine Google Play's public label with an internal cumulative snapshot; neither measures installs added on a specific day. The creatives quoted here are identified from the monitored set, and the media files embedded on this page are copies of that library's stored originals. Delivery dates and exposure figures on each card are that record's own values. A small cluster of early-October Meta statics with generic star-rating or unrelated narrative text is included in the headline counts but excluded from the creative analysis.
Get this live in your agent
These rankings come from a single MCP tool. Free key, ask in plain English.
Full genre × market grid?
Team plan unlocks every genre and market cut, plus AI teardowns.